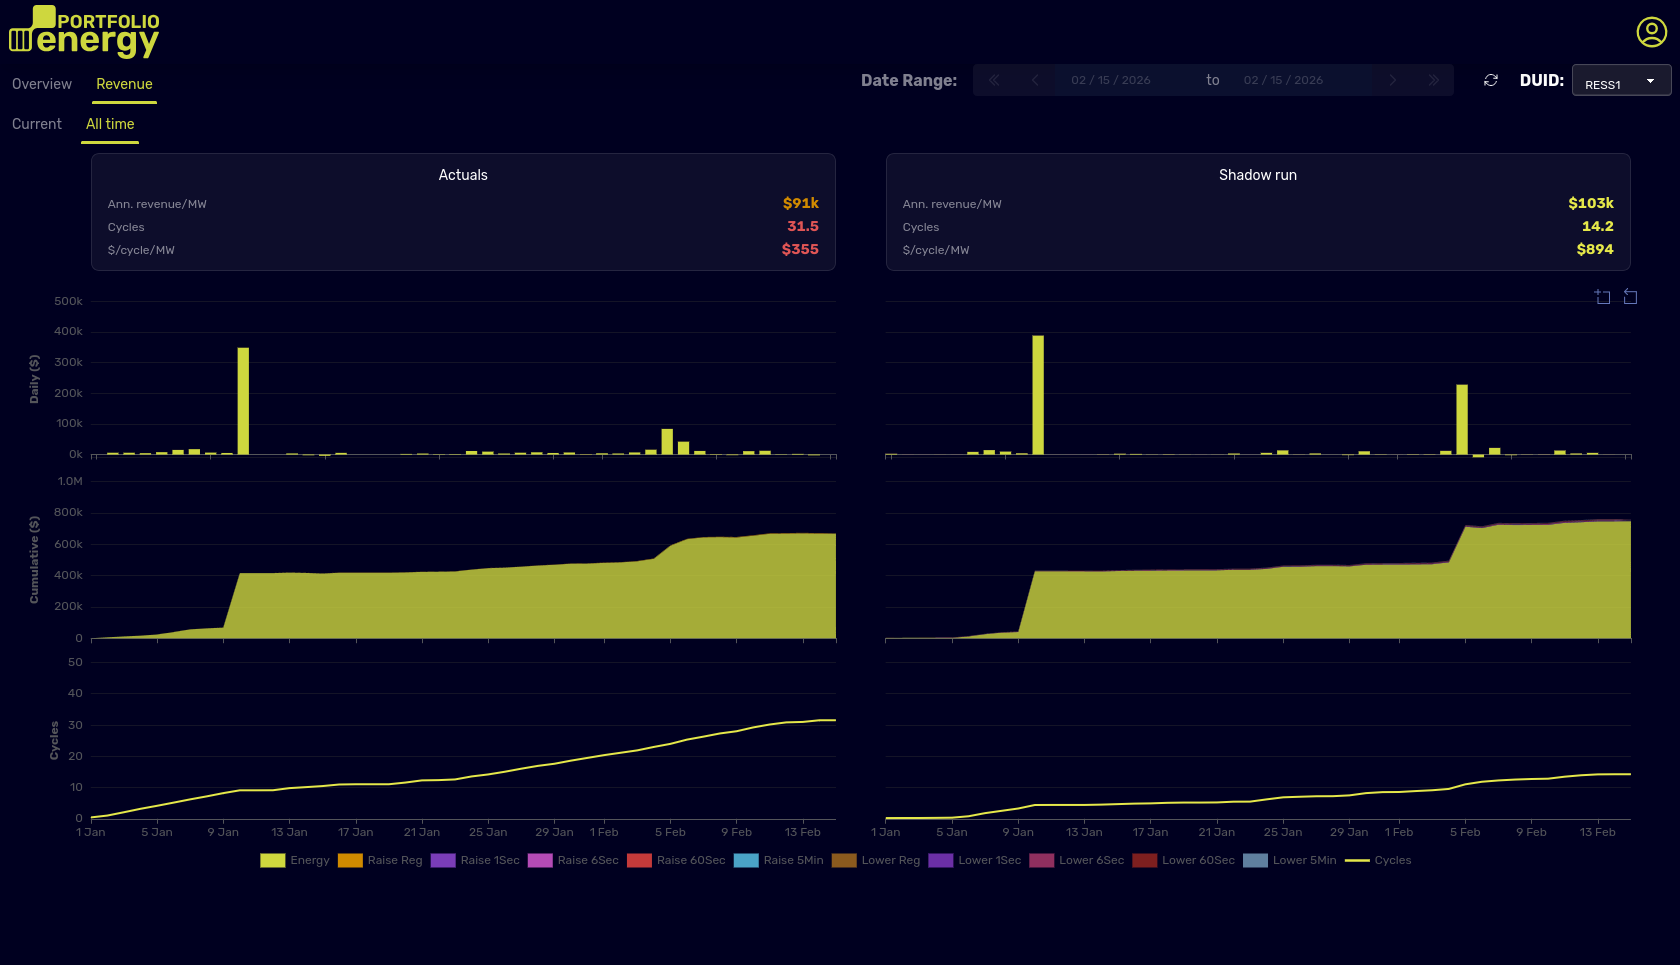
Revenue view for a NEM utility-scale BESS: Actuals (left) vs PortfolioEnergy shadow run (right). Data derived from publicly available AEMO settlement reports via NEMWeb.
How It Works
Two views, one dashboard, one ground truth
Actuals
- › Dispatched power allocations per dispatch interval
- › State of charge trajectory
- › Daily and cumulative trading revenue, broken down by market (energy, raise/lower FCAS)
- › Annualised revenue per MW, cycle count, and revenue per cycle
Derived from publicly available AEMO settlement reports via NEMWeb. Actuals are typically available with one day's delay; exact timing depends on AEMO data publication and is not guaranteed.
PortfolioEnergy Shadow Run
- › Optimised power allocations for the same asset and conditions
- › State of charge as the optimiser would have managed it
- › Daily and cumulative revenue the optimiser would have achieved
- › Annualised revenue, cycle count, and revenue per cycle
Computed using PortfolioEnergy's commercial platform running on AEMO pre-dispatch forecasts, settled against realised prices. The shadow run executes in real time within the trading day, consuming pre-dispatch data from NEMWeb as it becomes available — which may lag behind AEMO's InfoServer feed.
Coverage spans every utility-scale BESS currently operating in the NEM, updated continuously as new settlement data is published. Select any asset by DUID to explore its history.
Who It's For
Independent evidence for the decisions that matter most
Trading Teams & Asset Owners
Give your trading team or optimiser an independent, continuously updated benchmark to measure against — and a clear signal when there is room to improve.
SIPS & Contracted Services
System Integrity Protection Scheme (SIPS) contracts deliver revenue certainty but lock your asset out of arbitrage and FCAS opportunities during system-stress events. Benchmark your contracted revenue against the merchant counterfactual to confirm you're getting fair value.
BESS Developers
Build a rigorous evidence base for optimiser selection during procurement. Compare performance across the entire NEM fleet and arrive at your purchasing decision with independently verified data.
Considering a Switch
Quantify exactly what a move to PortfolioEnergy is worth before you commit. See the revenue gap on your own assets, under real market conditions, with no reliance on vendor-supplied figures.
Built on Public Data
Independently Verifiable
All actual performance data is sourced from AEMO's publicly available settlement reports via NEMWeb. There is nothing to take on faith.
NEM-Wide Coverage
The dashboard covers every utility-scale BESS in the NEM — not a curated selection. Explore the full picture across all operators, states, and asset sizes, filterable by DUID.
Access & Pricing
Vetted access, available now — request a demo or discuss pricing
Vetted access on request
Access is available to qualified organisations. We review each application and reserve the right to decline. This keeps the dashboard useful and the data environment trustworthy for all subscribers.
Pricing on request
Contact us to discuss pricing for your organisation, or sign up directly using the button below.
Ready to see how your BESS stacks up? Get in touch to request a demo or discuss pricing at info@portfolioenergy.com or use the form below.
Want This Performance on Your Asset?
The shadow run you see in the dashboard is powered by the NEM Autobidder — PortfolioEnergy's fully automated, co-optimised bidding engine. If the gap is worth closing, we can close it.